State Treasury Comparison
This feature allows you to see how your organization's financial performance compares to state treasury averages for similar entities in your state.
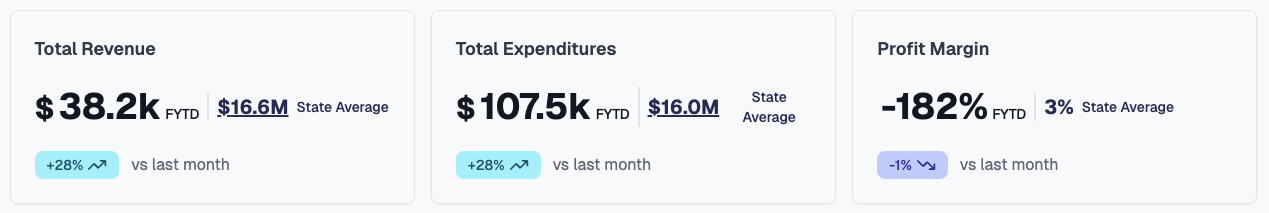
What You'll See
On your dashboard, you'll notice that the Total Revenue, Total Expenditures, and Profit Margin cards display two values:
-
Your Organization's Value: The large number shows your organization's actual fiscal year-to-date (FYTD) performance.
-
State Average: Next to your value, you'll see a separate number labeled "State Average" that shows the average for similar organizations in your state, adjusted for the current point in your fiscal year.
Viewing Detailed Breakdowns
You can click on the Total Revenue or Total Expense cards to open a detailed breakdown modal that shows:
- Category-Level Comparisons: See how your revenue and expense categories compare to state averages
- Per Capita Details: Go beyond measuring by the average and see how you compare on a per capita basis for each category
- Visual Representations: Bar charts showing your performance against state benchmarks
- Percentage Differences: Clear indicators of how far above or below state averages you are in each category
This detailed view helps you identify specific areas where your organization differs from state averages, allowing for more targeted financial strategies.
How It Helps You
The state treasury comparison provides valuable insights that help you:
Benchmark Your Performance
See how your financial metrics compare to state averages, giving you context on whether your revenue and spending patterns align with other similar organizations.
Identify Opportunities and Risks
- Above Average Revenue: May indicate strong financial performance or effective revenue generation strategies.
- Below Average Revenue: Could highlight opportunities to explore additional revenue sources.
- Above Average Expenses: Might reveal areas where cost management could be improved.
- Below Average Expenses: Could reflect efficient operations or potential underinvestment.
Support Decision Making
- Use these comparisons when preparing budgets and financial forecasts.
- Reference state averages during board meetings and stakeholder presentations.
- Identify specific areas where your organization differs significantly from state norms.
How It Works
The comparison is calculated using these steps:
-
Data Source: We incorporate official state treasury averages for different organization types.
-
Fiscal Year Adjustment: Since your fiscal year may differ from the calendar year, we adjust the state averages to match your current fiscal year progress.
-
Automatic Updates: As you progress through your fiscal year, the state average comparison will automatically adjust to show the appropriate year-to-date comparison.
Interpreting the Results
When evaluating your performance against state averages, consider these factors:
- Local Economic Conditions: Regional economic factors may cause variations.
- Organization Size: Larger organizations may have different patterns than smaller ones.
- Special Circumstances: One-time events or special projects may cause temporary deviations.
- Service Scope: Organizations offering more extensive services typically have higher expenses.
Future Enhancements
We're continually improving this feature and plan to add:
- Historical trend comparisons
- Additional visualization options
- Customizable comparison groups
- Export functionality for your comparison data
Questions or Feedback?
If you have questions about how to interpret your state comparison data or suggestions for improving this feature, please contact our support team at support@simplysolv.com.